An ordinary user rarely monitors the readings of the sensors installed in the computer. Gamers, miners, testers, overclockers, employees of service centers and stores regularly use software tools to monitor the operation of components. Among the market leaders is the HWiNFO utility. It displays over a hundred dynamic parameters, collects dozens of pages of information about the system's hardware resources.
The application consists of several tools. Most of the parameters are for the module with sensor readings. Let's look at how to use the HWiNFO monitoring program: what shows you how to display the necessary information in an overlay, view graphs, and make custom reports.
We will test the CPU, storage, RAM. Let's deal with the functions and settings of Hardware Information for Windows.
Setting up HWiNFO to work
The launcher allows you to run one of the versions of the program: Summery and Sensor.
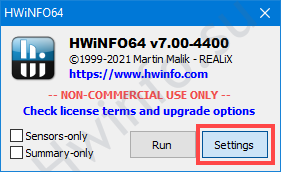
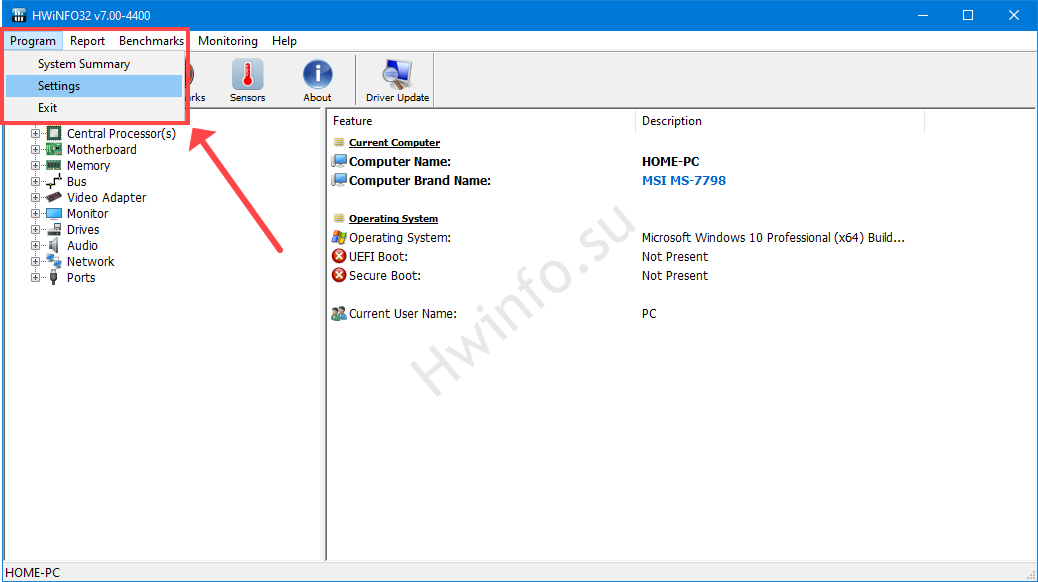
The application consists of three fundamental and a number of additional tools. Global settings are called through the main menu item "Program" at the stage of selecting components to launch.
The settings window is represented by four tabs:
- General / User Interface - General / Design - settings for the behavior of the HWiNFO interface.
- Safety - safety parameters.
- SMSBus/I2C - bus configuration I2C.
- Driver Management - driver management
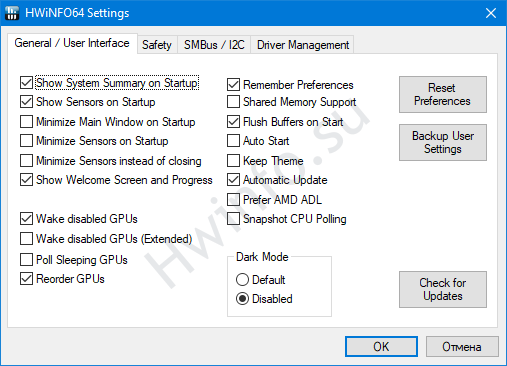
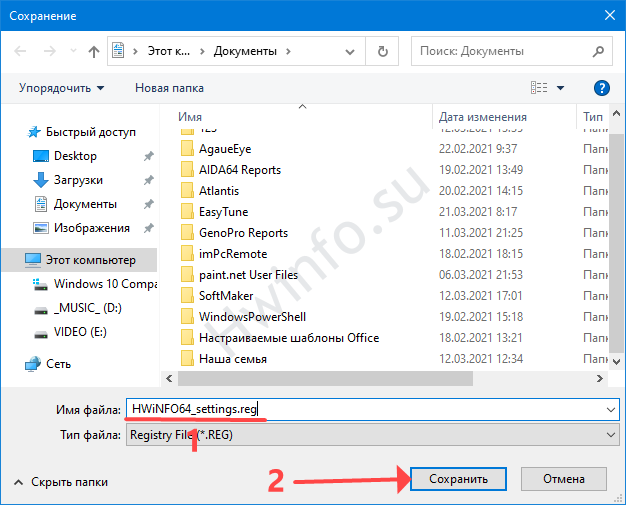
The current configuration is saved to a .reg file with the "Backup User Settings" button. Applied by running this file.
The interface of the program
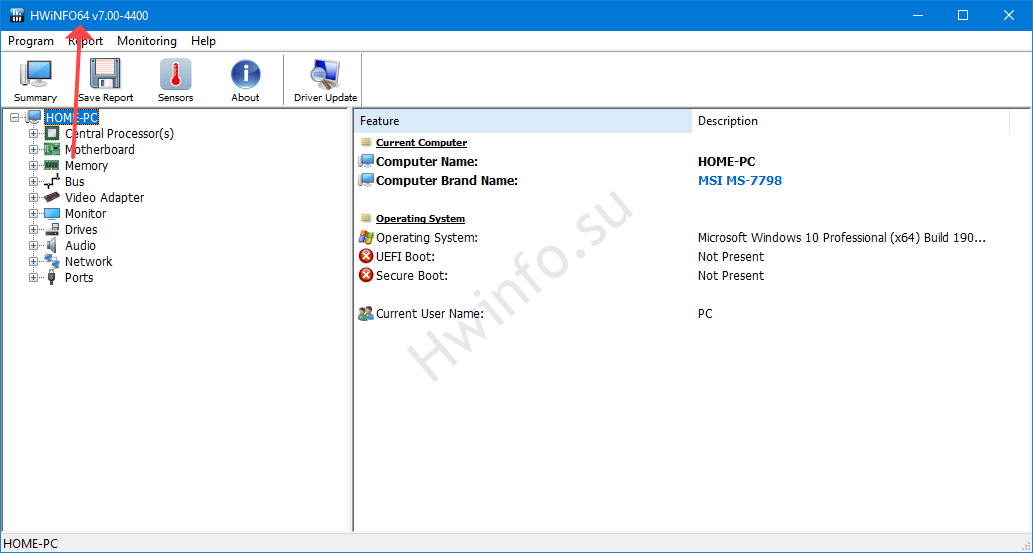
When launching HWiNFO, you can select the modules you need or run them from the main window: Reporter, Benchmark, Sensors, and Summary Information. It displays detailed information about the hardware components of the computer and laptop:
- CPU;
- motherboard;
- RAM;
- tire;
- graphics accelerator;
- monitor;
- drives;
- sound devices;
- network cards, modems;
- ports and peripherals connected to them: printers, flash drives.
There is no information about input devices (mouse, keyboard).
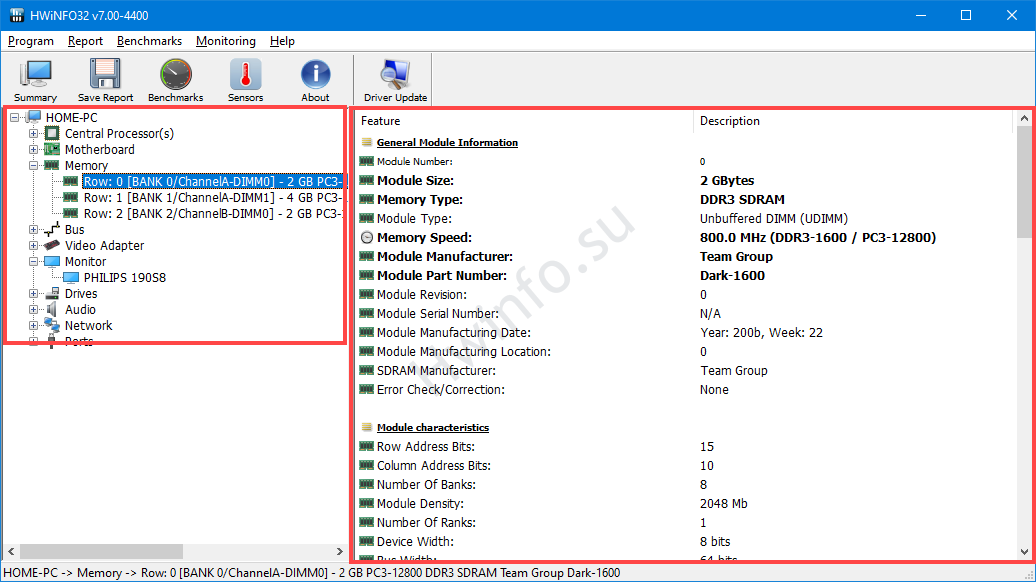
Moving along the equipment tree on the left, select the device of interest. On the right you will see details about it.
You can find tests of the processor, drives and RAM only in HWiNFO for Windows x32, there is no benchmark in the 64-bit operating system.
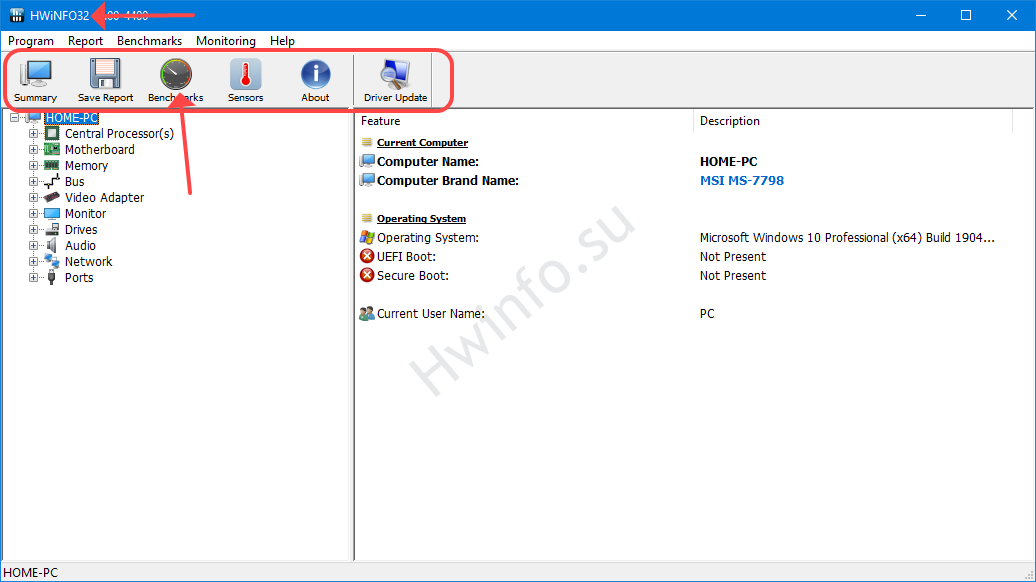
HWiNFO32 runs on Windows of any bit depth.
Sensor tab
The most informative HWiNFO window. Interrogates dozens of PC sensors (temperature, voltage, frequency), reads the dynamic parameters of the system (load of physical and virtual memory, processor, video card, drives, RAM timings). Shows the intensity of operation of logical disks: read speed, write speed, Internet channel load in both directions.
Of the other functions of the module:
- Increase and decrease the number of windows using the "Expand ..." and "Shrink" buttons. By default, information from sensors is displayed in one window.
- Application for remote monitoring - viewing information from computer sensors over the network.
- Export information to a file.
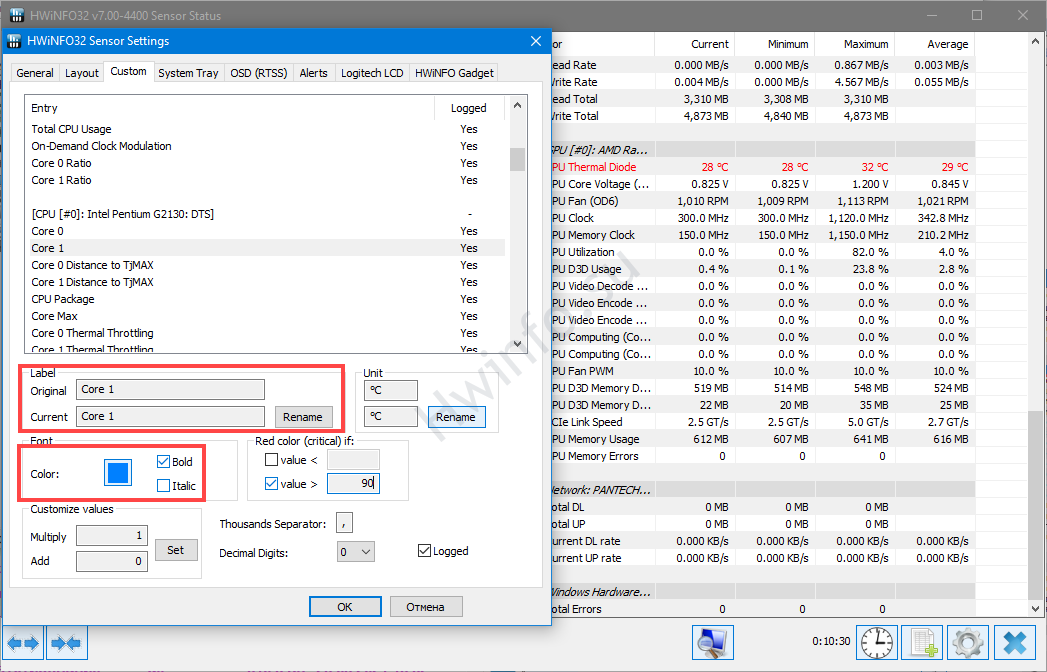
- Sensor settings.
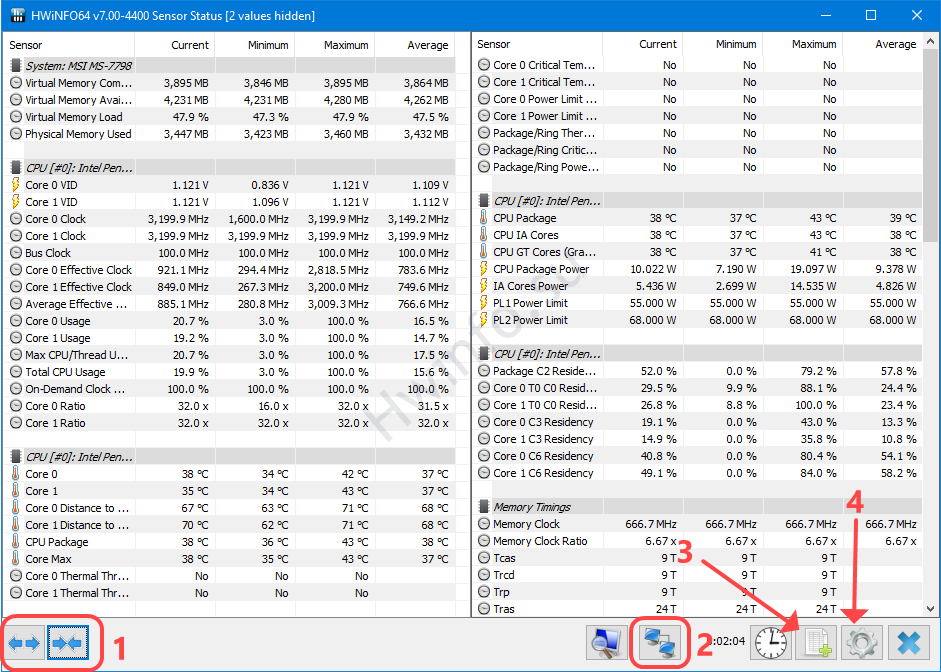
In the window with sensor configuration parameters (are called by button 4 in the screenshot above) the presentation of data from sensors is configured. The variety of options is amazing.
Here you can:
- Change the color, font of parameters, their groups, for example, frequencies.
- Hide unnecessary indicators (by group or one by one).
- Add options icons to tray or transfer to desktop gadget.
- Select indicators to display in the overlay (overlay). Need Riva Tuner Statistics Server.
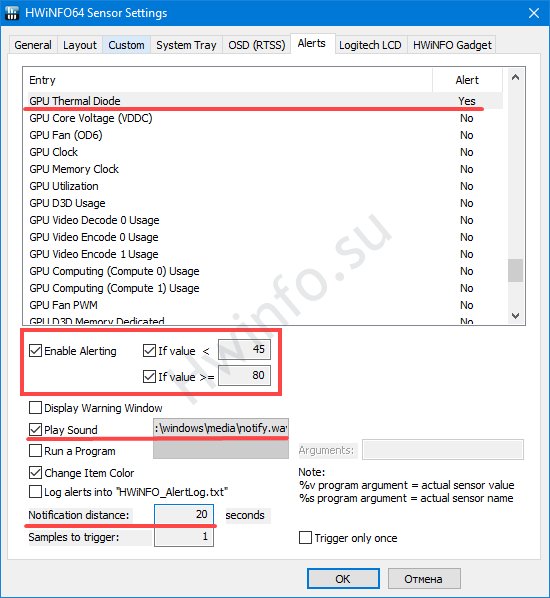
The "Alert" tab specifies the conditions for displaying warnings about a parameter going beyond the specified values.
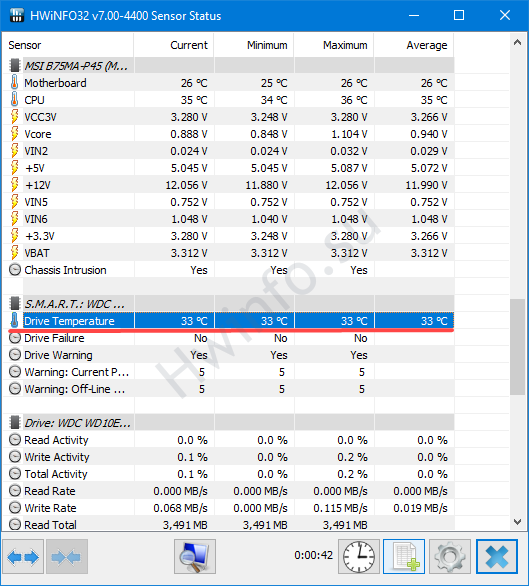
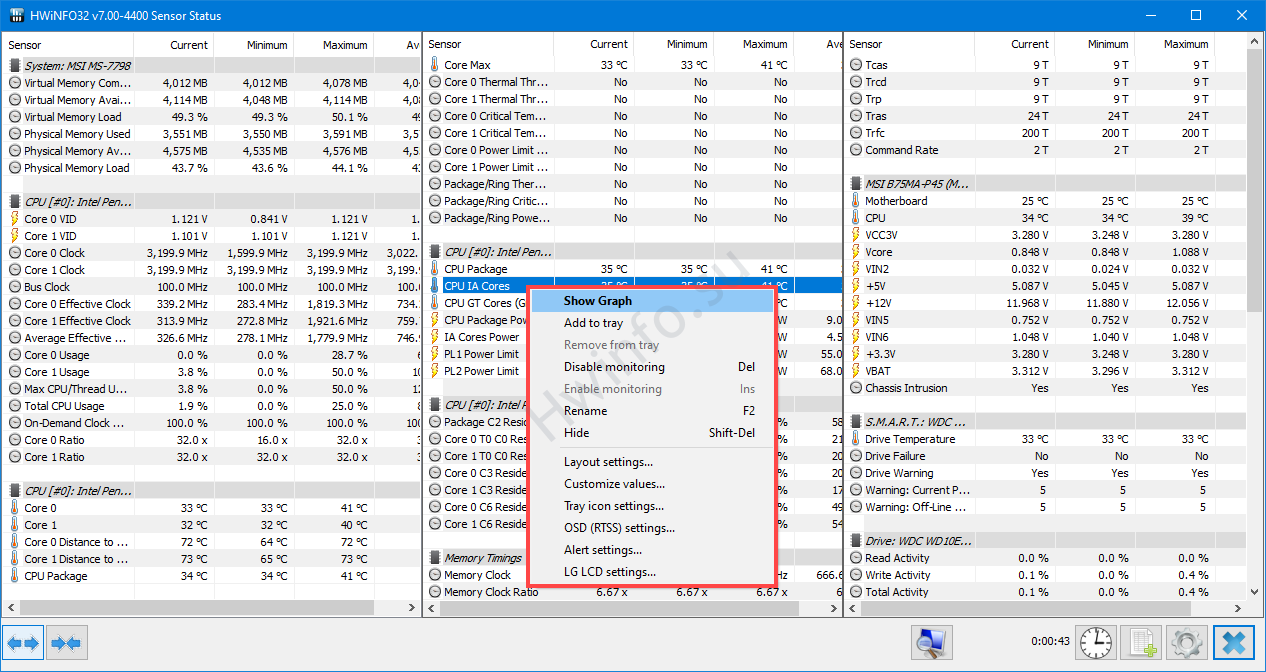
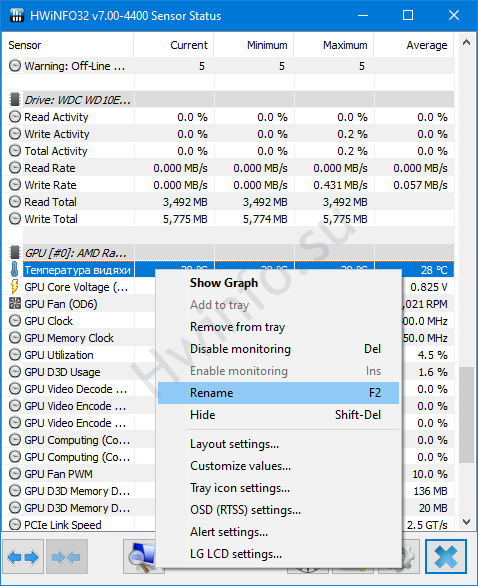
The columns display (in order) the current, minimum, maximum values recorded for the session and the average "Average". The monitoring data is reset by the button with the clock at the bottom. Right-clicking on the parameter opens the context menu, from where you can hide it, change the design, move it to the tray, rename it.
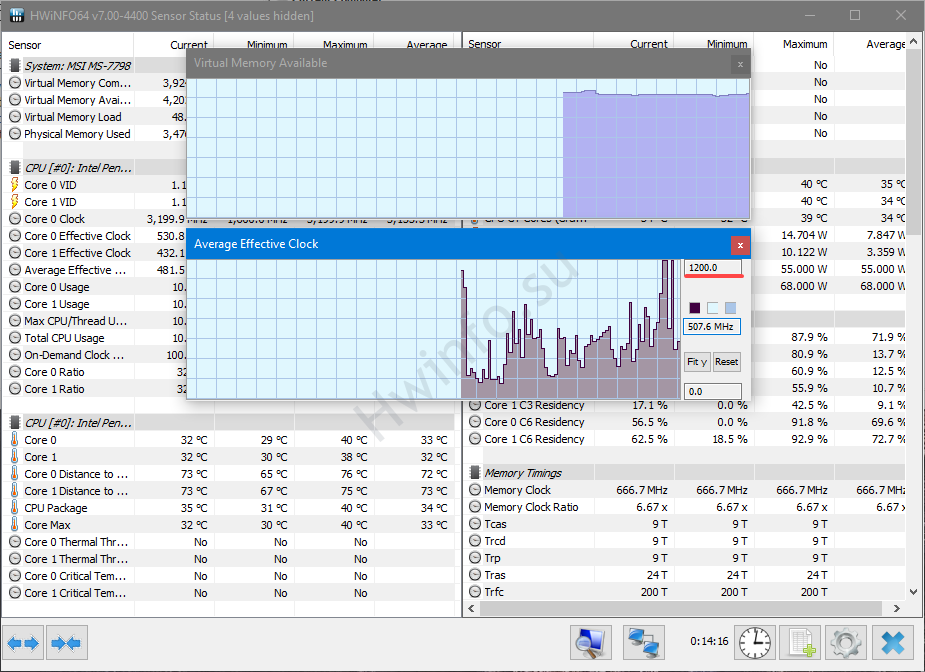
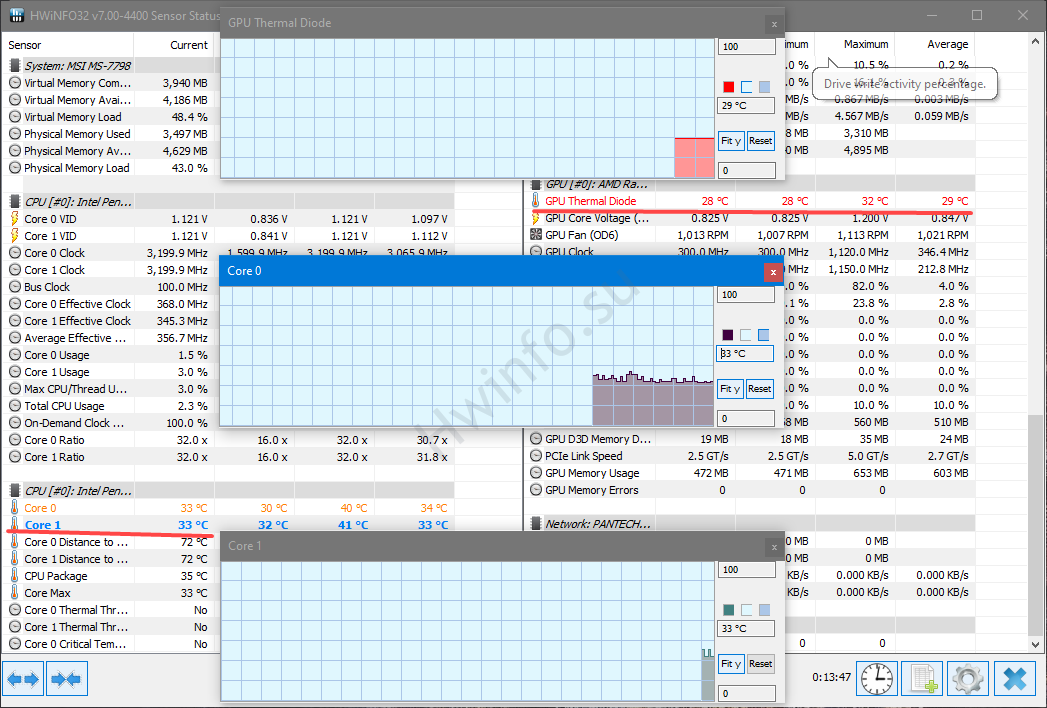
Double-clicking visualizes the parameter graphically. The number of graphs is limited by the size of the display, they move around the screen, the scale changes along the y-axis - enter the value in the upper field of the window - the colors of the values. The panel with parameters is hidden/opened by double clicking.
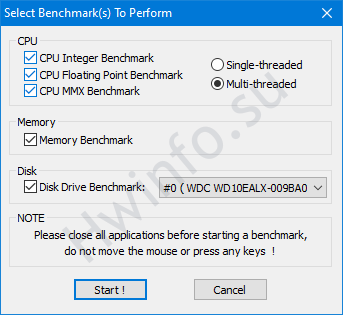
Benchmarks Tab
HWiNFO tool for testing the processor in single and multi-threaded modes (three algorithms), evaluating the speed of RAM, reading and writing the drive.
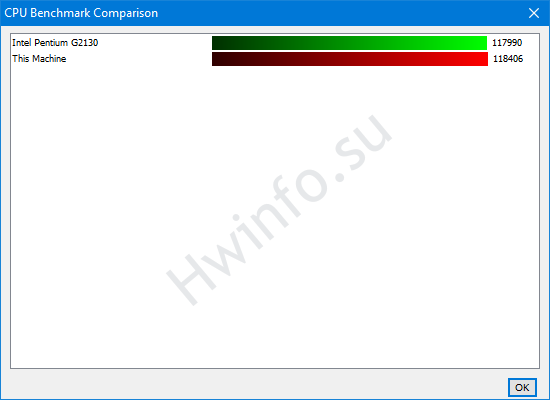
After saving the result with the "Save Results" button, you can compare the results - click "Compare".
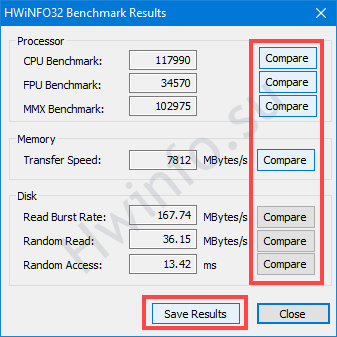
The result of the performance evaluation.
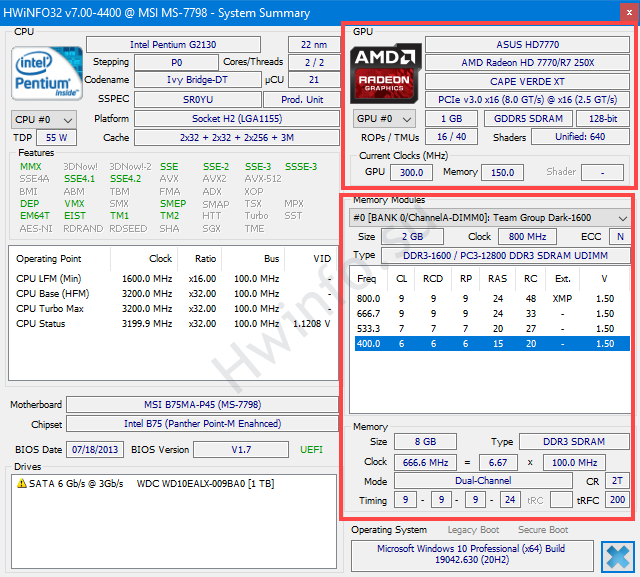
Section "Summary"
Reminiscent of the synthesis of the main windows of CPU-Z and GPU-Z.
In the left frame are collected:
- information about the processor: logo, name, specification, thermal package, supported instructions;
- below - frequency characteristics;
- the name of the motherboard and chipset;
- version, BIOS release date;
- A brief note about drives.
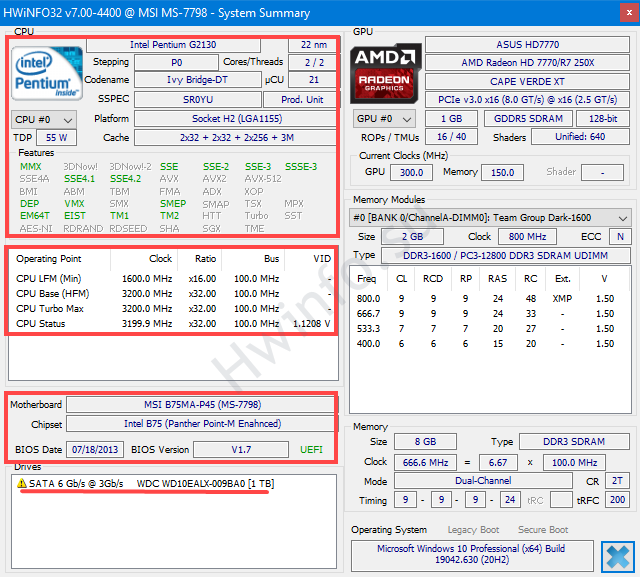
On the right - information about the video card, video (GDDR) and RAM.
Pro GPU outputs:
- technical details;
- nominal frequencies of memory, shaders, core;
- data exchange interface.
Below is information about RAM modules: volume, manufacturer, timings, frequency, multiplier.
How to see the temperature of the processor and video card
Open the "Sensor Status" window. Under "CPU[#0] Processor name» look for Core 0, Core 1, etc. for each physical core. Current indicators are in the first column.
Attention. The numbers may vary.
In the "GPU [#0]" or "GPU [#1]" section if there are two video cards. Interested in the "GPU Thermal Diod" parameter with a thermometer icon.
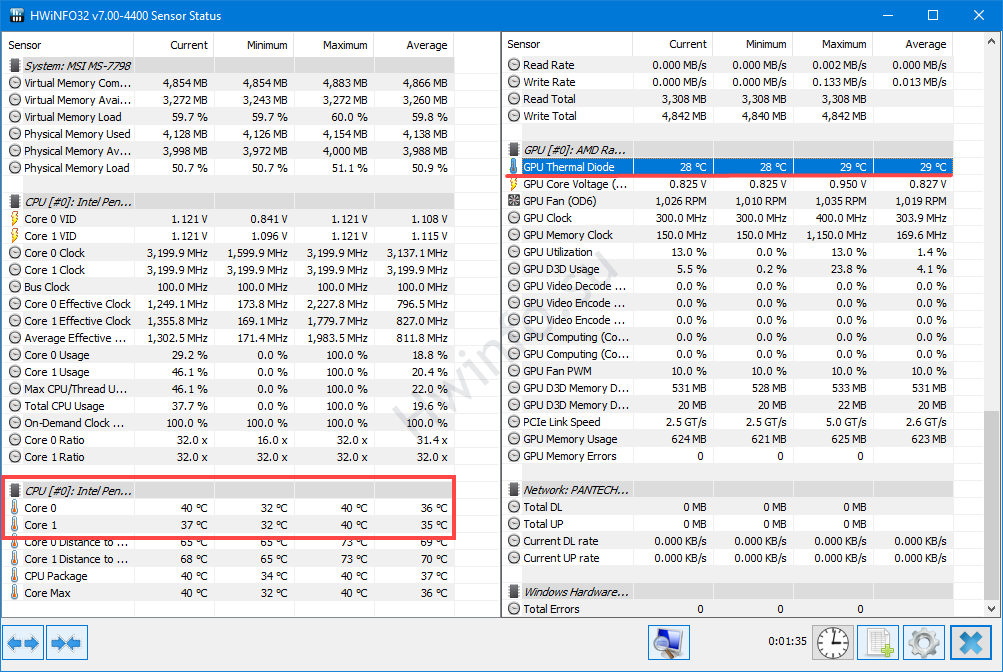
Through the right click, you can send the indicator to the tray, change the color of the text for quick detection, for example, to red. Allows you to edit the name of the parameter, correct the result, turn on the warning about overheating.
How to display processor and video card graphs
In "Sensor Status" find the parameters described above and double click on each to visualize the graphs.
How to run a CPU test
The processor testing process is shown below. Processor test only works in 32 bit version.
Monitoring in games
For dynamic readings on top of games, RivaTuner Statistic Server is required. Download and install separately or together with MSI Afterburner.
The video card temperature output setting is shown in the animation. Run RTSS and the "Sensor Status" module beforehand.
The "Show label in OSD" option is optional. After activation, next to the number, the decoding of the parameter will be displayed - “GPU Thermal Diode”. You can rename with the F2 key or right click.
BIOS Update
If you are using older versions of the application, do not touch this button. HWiNFO is not recommended for updating BIOS and UEFI firmware. This feature has been removed in the latest versions of the program.
Update drivers
The button will launch a browser window on a page with a utility for checking the status, searching for and installing the latest drivers for the equipment.
How to save a PC hardware report
The tool for generating reports in HWiNFO is called by the "Save Reports" button.
- In the window, select the format (MHTML, HTML, CSV, TXT, CDF) and the storage location for the output file.
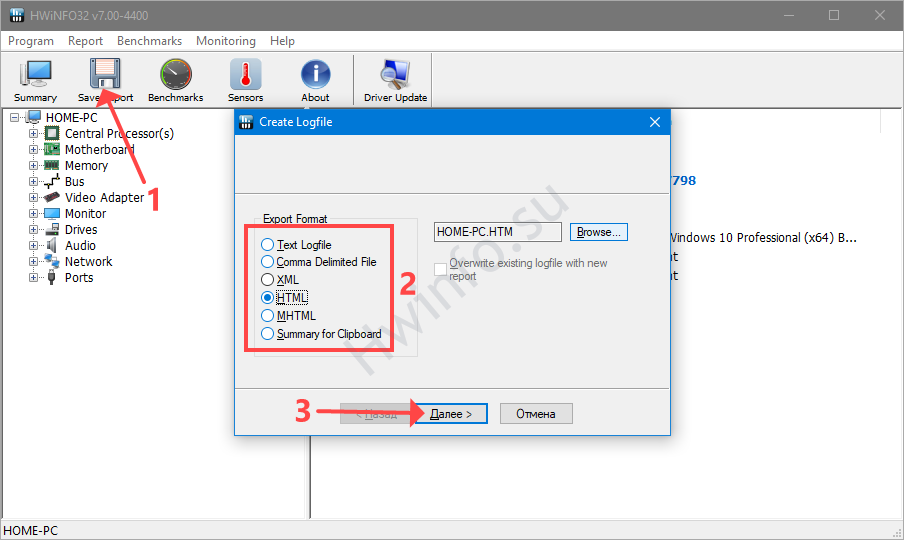
Variety of presentations. - Check the boxes of interest and click "Finish".
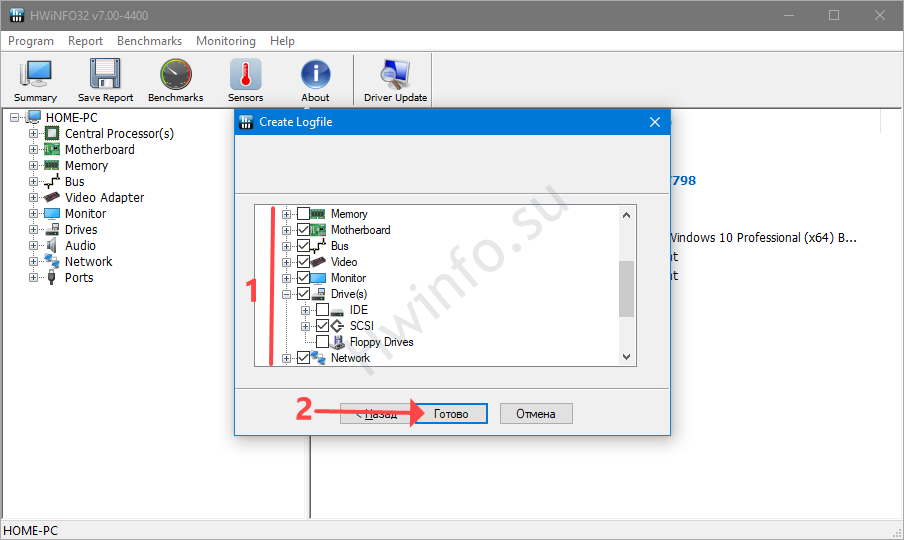
Branches are expanded by clicking on the plus sign. - The report will be generated in a split second. Look for it in the directory specified in the previous step. By default, this folder contains the executable file.
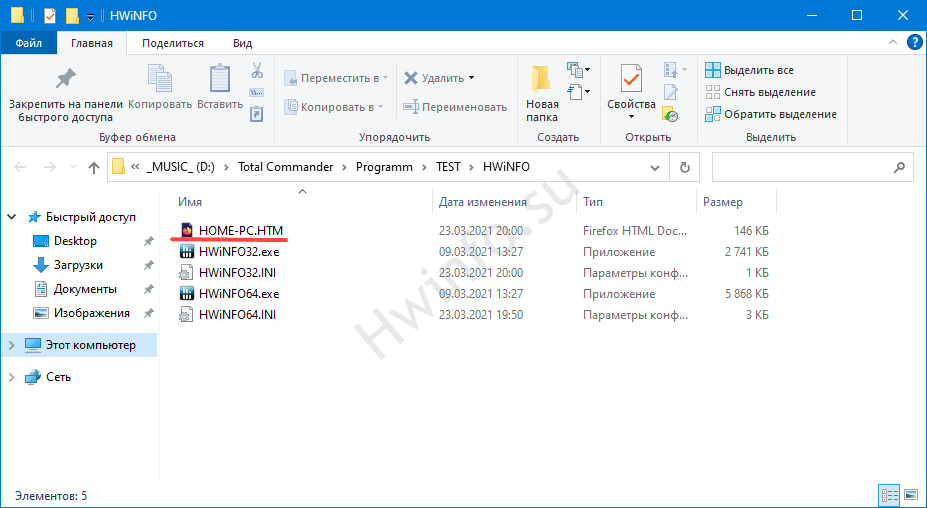
The report is saved next to the program executable.
Questions and Answers
Describe the problems, we will solve them, tell you, use certain HWiNFO functions.
How to control fan speed?
In the Sensor Status module, click on the fan icon at the bottom. On the right, set the active cooling operation parameters.
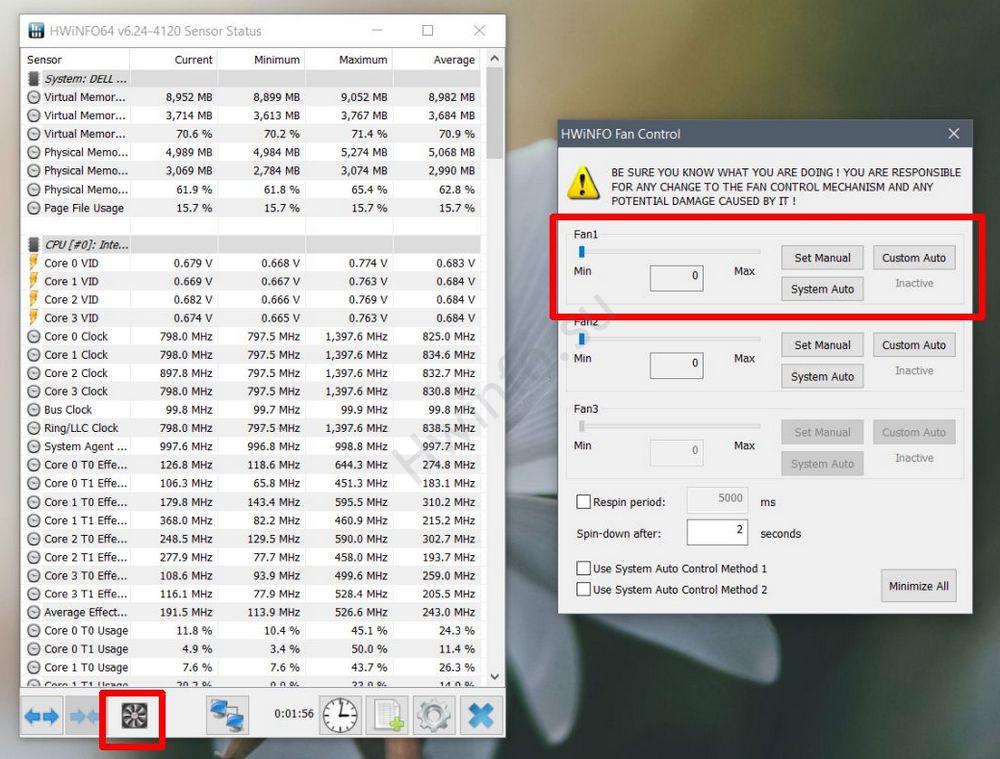
Few devices support fan speed control: Alienware, DELL laptops (most models), a few HP units.
Can HWiNFO show hard disk temperature?
Yes. "Sensor Status", section "SMART Name_HDD", line "Drive Temperature".